Abstract
The storage subsystem has undergone tremendous innovation in order to keep up with the ever-increasing demand for throughput. Non Volatile Memory Express (NVMe) based solid state devices are the latest development in this domain, delivering unprecedented performance in terms of latency and peak bandwidth. NVMe drives are expected to be particularly beneficial for I/O intensive applications, with databases being one of the prominent use-cases.
This paper provides the first, in-depth performance analysis of NVMe drives. Combining driver instrumentation with system monitoring tools, we present a breakdown of access times for I/O requests throughout the entire system. Furthermore, we present a detailed, quantitative analysis of all the factors contributing to the low-latency, high-throughput characteristics of NVMe drives, including the system software stack. Lastly, we characterize the performance of multiple cloud databases (both relational and NoSQL) on state-of-the-art NVMe drives, and compare that to their performance on enterprise-class SATA-based SSDs. We show that NVMe-backed database applications deliver up to 8× superior client-side performance over enterprise-class, SATA-based SSDs.
Categories and Subject Descriptors C.4 [Computer Systems Organization]: [Performance Of Systems][Measurement Techniques]
Keywords SSD, NVMe, Hyperscale Applications, NoSQL Databases, Performance Characterization
Permission to make digital or hard copies of part or all of this work for personal or classroom use is granted without fee provided that copies are not made or distributed for profit or commercial advantage, and that copies bear this notice and the full citation on the first page. Copyrights for third-party components of this work must be honored. For all other uses, contact the owner/author(s). Copyright is held by the author/owner(s).
SYSTOR ‘15, May 26–28, 2015, Haifa, Israel.
Copyright §c 2015 ACM ISBN. 978-1-4503-3607-9/15/05. . . $15.00.
http://dx.doi.org/10.1145/ http://dx.doi.org/10.1145/2757667.2757684
This paper is held by authors. The reference here is only for personal study. Contact the authors for commercial uses.
Authors:
Qiumin Xu, Huzefa Siyamwala, Mrinmoy Ghosh, Tameesh Suri, Manu Awasthi, Zvika Guz, Anahita Shayesteh, Vijay Balakrishnan
Univeristy of Southern California, San Jose State University, Samsung Semiconductor Inc., Milpitas, CA
1 Introduction
In recent years, a large amount of the world’s compute and storage has been pushed onto back-end datacenters. Large-scale datacenters host multitude of applications that run simultaneously, cater to many millions of active users, and service billions of transactions daily. With the explosion in the amount of data stored and processed by today’s “Big Data” applications (Diebold2000), the load on the I/O subsystem in these datacenters has been increasing at an alarming rate (Hoelzle and Barroso2009).
To meet the ever-increasing performance demands, storage subsystems and data-storage devices had to evolve. While every new generation of drives provided a modest performance improvement over its predecessor, several innovations in drive technology introduced major leaps over the previous state-of-the-art. Solid State Drives (SSDs) were the first technology leap - owing to the lack of moving parts, they delivered significantly better random-access read performance as compared to hard disk drives (HDDs). The recently announced Non-Volatile Memory Express (NVMe) drives represents the second major technology leap. NVMe is a software based standard (Huffman2012; NVM-Express 2012) that was specifically optimized for SSDs connected through the PCIe interface. The effort has been focused towards building a standard that will not only provide better performance and scalability, but will also be flexible enough to accommodate storage solutions based on memory technologies of the future (Huffman, A. and Juene- mann, D.2013). Designed with those goals in mind, NVMe-based drives are able to deliver vastly superior performance in terms of both bandwidth and latency. In Section2 we overview the design features of NVMe, and contrast them with their SATA counterparts.
Being a relatively new standard, there is little available research on where the performance benefits of NVMe-based drives emanate from. Indeed, to the best of our knowledge, this paper is the first analysis of NVMe drives and their I/O stack. In Section3, we use synthetic benchmarks to stress-test the drives and provide an in-depth analysis of their performance. We combine driver instrumentation with block layer tools like blktrace to break down the time spent by the I/O requests in different parts of the I/O subsystem. We report both latency and throughput results, and quantify all major components along the I/O request path, including user mode, kernel mode, the NVMe driver, and the drive itself. Our analysis quantifies the performance benefits of the NVMe protocol, the throughput offered by its asynchronous nature and the PCIe interface, and the latency savings obtained by removing the scheduler and queuing bottlenecks from the block layer.
NVMe drives are expected to be widely adopted in data-centers (Bates2014; Thummarukudy2014; Jo2014), where their superior latency and throughput characteristics will benefit a large set of I/O intensive applications. Database Management Systems (DBMS) are primary examples of such applications. These datacenters run a multitude of database applications, ranging from traditional, relational databases like MySQL, to various NoSQL stores that are often a better-fit for “web 2.0” use-cases. In Section4, we study how the raw performance of NVMe drives benefits several types of database systems. We use TPC-C to characterize MySQL (a relational database), and use YCSB to characterize Cassandra and MongoDB - two popular NoSQL databases. We compare the performance of these systems on a number of storage solutions including single and multiple SATA SSDs, and show that NVMe drives provide substantial system-wide speedups over other configurations. Moreover, we show that unlike SATA-based SSDs, NVMe drives are never the bottleneck in the system. For the majority of our experiments with the database applications under test, we were able to saturate different components of the system including the CPU and the network and were restricted by the application software, but never by the NVMe drives. To summarize, we make the following novel contributions:
- Compare and contrast the I/O path of the NVMe stack against the traditional stack used by SATA SSDs
- Create a tool using
blktraceto measure the NVMe stack - Provide detailed break-down of the latency through the different software components of the I/O stack, and explain the factors that lead to performance benefits of NVMe-based SSDs
- Characterize the performance of several MySQL and NoSQL databases, comparing SATA SSDs to NVMe drives, and show the benefits of using NVMe drives
The rest of the paper is organized as follows. Section2 presents the design details and innovative features of the NVMe standard. Section3 builds on the knowledge gathered in the previous section and provides an outline of the blktrace based tool and driver instrumentation done to do the measurements. These tools are then used to provide insights into NVMe performance. Next, in Section4, we provide performance characterization of the three different database workloads, and compare the performances of these workloads on different storage devices. Related work is provided in Section5, and we conclude in Section6.
2 NVMe Design Overview
Legacy storage protocols like SCSI, SATA, and Serial Attached SCSI (SAS), were designed to support hard disk drives (HDDs). All of these communicate with the host using an integrated on-chip or an external Host Bus Adaptor (HBA). Historically, SSDs conformed to these legacy interfaces and needed an HBA to communicate with the host system. As SSDs evolved, their internal bandwidth capabilities exceeded the bandwidth supported by the external interface connecting the drives to the system. Thus, SSDs became limited by the maximum throughput of the interface protocol (predominantly SATA) (Walker2012) itself. Moreover, since SSD access latencies are orders of magnitude lower than that of HDDs, protocol inefficiencies and external HBA became a dominant contributor to the overall access time. These reasons led to an effort to transition from SATA to a scalable, high-bandwidth, and low-latency I/O interconnect, namely PCI express (PCIe).
Any host-to-device physical layer protocol such as PCIe or SATA, requires an abstracted host-to-controller interface to enable driver implementation. (For example, the primary protocol used for SATA is AHCI (Walker2012)). A major inhibitor to the adoption of PCIe SSDs proved to be the fact that different SSD vendors provided different implementations for this protocol (NVM-Express2012). Not only that, vendors provided different drivers for each OS, and implemented a different subset of features. All these factors contributed to increased dependency on a single vendor, and reduced interoperability between cross-vendors solutions.
To enable faster adoption of PCIe SSDs, the NVMe standard was defined. NVMe was architected from the ground up for non-volatile memory over PCIe, focusing on latency, performance, and parallelism. Since it includes the register programming interface, command set, and feature set definition, it allows for standard drivers to be written and hence facilitates interoperability between different hardware vendors. NVMe’s superior performance stems from three main factors:
- (1) better hardware interface,
- (2) shorter hardware data path,
- (3) simplified software stack.
Interface capabilities: PCIe supports much higher throughput compared to SATA: while SATA supports up to 600MB/s, a single PCIe lane allows transfers of up to 1GB/s. Typical PCIe based SSDs are ×4 PCIe generation 3 devices and support up to 4GB/s. Modern x86 based chipsets have ×8 and ×16 PCIe slots, allowing storage devices to have I/O bandwidth up to 8-16GB/s. Therefore, the storage interface is only limited by the maximum number of PCIe lanes supported by the microprocessor.
Intel Xeon E5 16xx series or later support 40 PCIe lanes per CPU, allowing I/O bandwidth of up to 40GB/s.
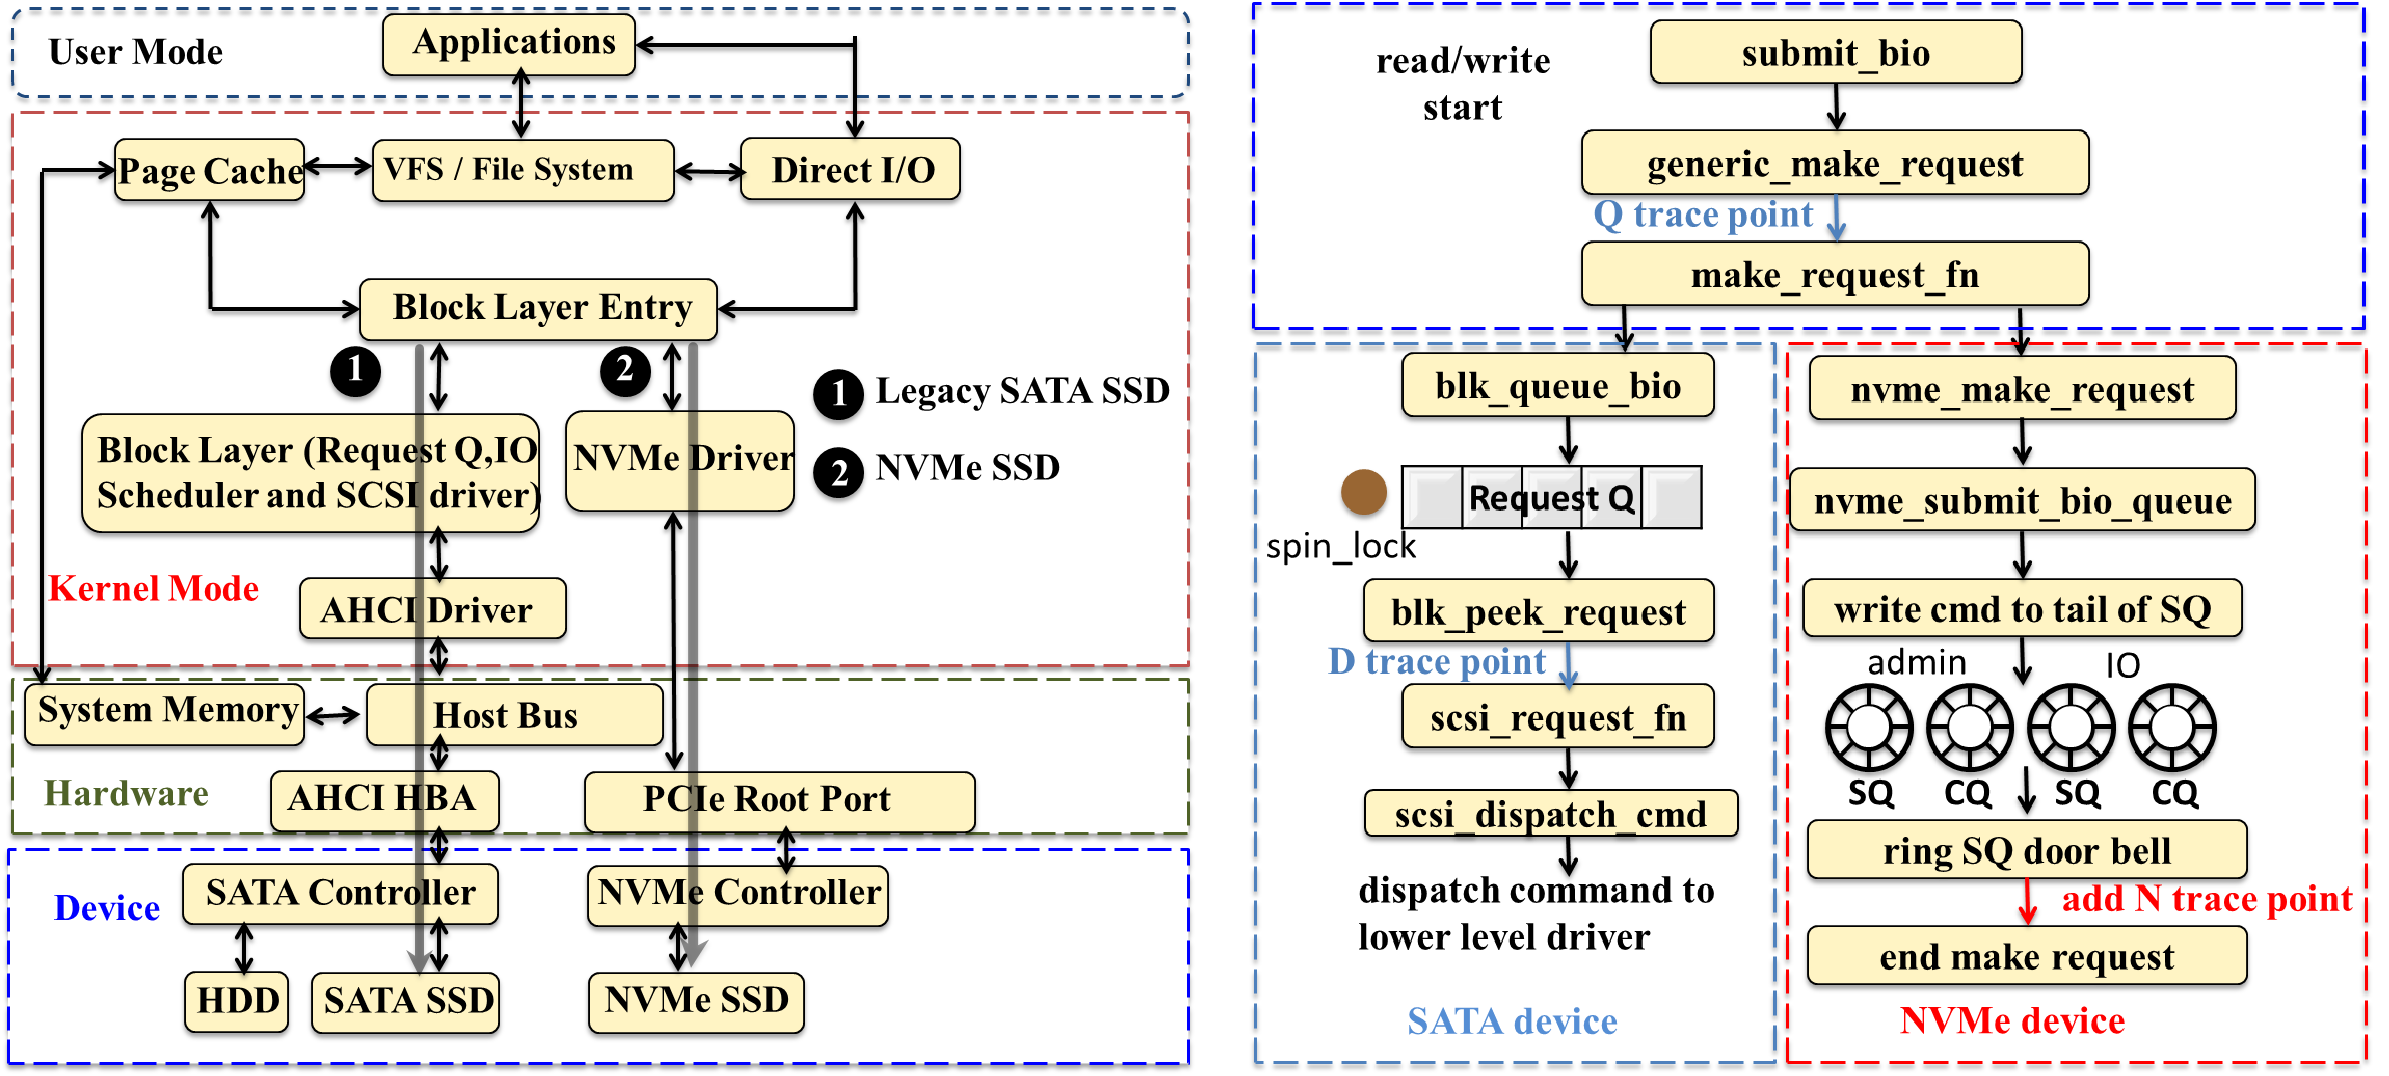
Figure 1: (a) A comparison of the software and hardware architecture of SATA HDD, SATA SSD, and NVMe SSD. (b) An illustration of the I/O software stack of SATA SSD and NVMe SSD.
Hardware data path: Figure1(a) depicts the data access paths of both SATA and NVMe SSDs. A typical SATA device connects to the system through the host bus. An I/O request in such a device traverses the AHCI driver, the host bus, and an AHCI host bus adapter (HBA) before getting to the device itself. On the other hand, NVMe SSDs connect to the system directly through the PCIe root complex port. In Section3 we show that NVMe’s shorter data path significantly reduces the overall data access latency.
Simplified software stack: Figure1(b) shows the software stack for both NVMe and SATA based devices. In the conventional SATA I/O path, an I/O request arriving at the block layer will first be inserted into a request queue (Elevator). The Elevator would then reorder and combine multiple requests into sequential requests. While reordering was needed in HDDs because of their slow random access characteristics, it became redundant in SSDs where random access latencies are almost the same as sequential. Indeed, the most commonly used Elevator scheduler for SSDs is the noop scheduler (Rice2013), which implements a simple First-In-First-Out (FIFO) policy without any reordering. As we show in Section3, the Elevator being a single point of contention, significantly increases the overall access latency.
The NVMe standard introduces many changes to the aforementioned software stack. An NVMe request bypasses the conventional block layer request queue (The 3.17 linux kernel has a re-architected block layer for NVMe drives based on (Bjørling et al.2013). NVMe accesses no longer bypass the kernel. The results shown in this paper are for the 3.14 kernel). Instead, the NVMe standard implements a paired Submission and Completion queue mechanism. The standard supports up to 64K I/O queues and up to 64K commands per queue. These queues are saved in host memory and are managed by the NVMe driver and the NVMe controller cooperatively: new commands are placed by the host software into the submission queue (SQ), and completions are placed into an associated completion queue (CQ) by the controller (Huffman 2012). The controller fetches commands from the front of the queue, processes the commands, and rings the completion queue doorbell to notify the host. This asynchronous handshake reduces CPU time spent on synchronisation, and removes the single point of contention present in legacy block drivers.
3 NVMe Performance Analysis
In this section we provide detailed analysis of NVMe performance in comparison to SATA-based HDDs and SSDs. First, in Section3.1, we describe our driver instrumentation methodology and the changes to blktrace that were done to provide access latency break downs. Sections3.2 and Section3.3 then use these tools to provide insight into analyzing the software stack and the device itself.
3.1 Driver and blktrace Instrumentation
We use fio (Axboe2014) to generate synthetic I/O traffic, and use blktrace (Axboe and Brunelle2007) to characterize individual drives and their software stacks. Unless stated otherwise, I/O traffic is generated using fio’s libaio asynchronous I/O engine. We bypass the page cache to ensure measurement of raw device performance. This is achieved by setting fio’s direct I/O flag. For our analysis, we also use two statistics reported by fio: (1) slat (submission latency), which is the time taken to submit the I/O request to kernel space; and (2) clat (completion latency), which is the time taken by the I/O request from submission to completion.
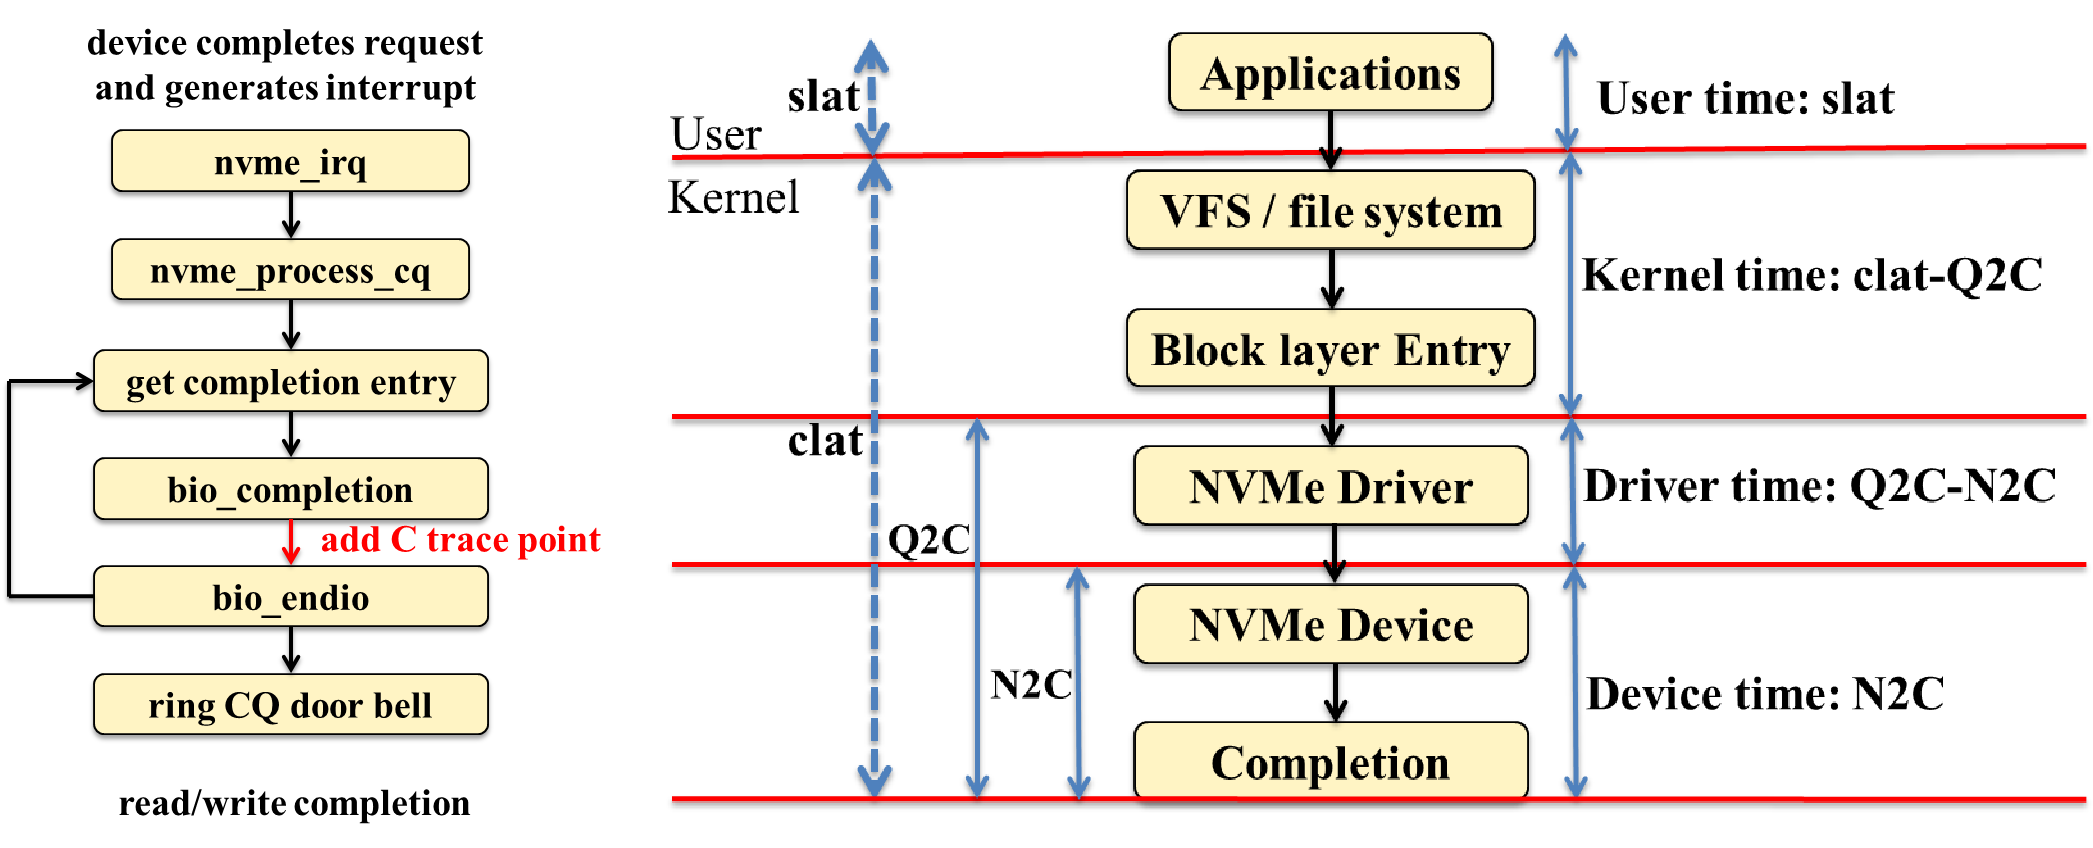
Figure 2: (a) NVMe request call graph. (b) Latency break-down.
Blktrace (Axboe and Brunelle2007) is a tool that enables tracing the path of an I/O operation throughout the I/O stack. It relies on tracepoints inserted into the Linux kernel in order to report information about multiple trace events. This includes, among other things, timestamp of the event, block addresses, PID of the requesting process and request type. While instrumentation for the SATA path is readily available, we had to manually instrument for the NVMe path, including the driver. Figure1(b) and Figure2(a) detail the instrumentation points along the I/O path for NVMe drives. In order to trace the life cycle of an I/O operation, following events needed to be traced through the NVMe storage stack.
- Queue insert time (Q tracepoint) - logs the time an I/O request is inserted into the request queue. This is the point where NVMe I/O flow starts to diverge from SATA.
- Driver issue time (D tracepoint) - logs the time an I/O request is issued to the driver on conventional SATA/SAS drives. Since the block layer in the NVMe datapath is extremely thin, the D tracepoint coincides with the Q tracepoint. Therefore, we do not instrument a separate D tracepoint for the NVMe datapath.
- NVMe Device issue time (N tracepoint) - We add this tracepoint in the NVMe driver after the submission queue door bell is rung, and the control of the request is handed over to the NVMe controller (Figure1(b)). This repre- sents the NVMe device issue time.
- Completion time (C tracepoint) - logs the time for I/O completion (Figure2(a)).
We use two metrics obtained by post processing blktrace traces using a modified version of blkparse. The metrics computed are Queue to Completion time (Q2C) and NVMe Device to Completion time (N2C). The desciptions of Q2C and N2C can be seen in Figure2(b). In addition to Q2C and N2C, we also use statistics reported by fio: slat and clat. Definitions of slat and clat can also be found in Figure2(b).
As illustrated in Figure2(b), we break down the total NVMe access latencies into the following components: user time, kernel time, driver time, and device time. User time is the time spent by the user application to transfer control to kernel level syscall, which equals to slat. Kernel time is the time spent from entering the kernel to the time the request enters the NVMe driver. It can be calculated by subtracting Q2C latency from clat. Driver time is the time spent in NVMe driver which is equal to the time from Q trace point to N tracepoint. After the N tracepoint, the access is handed to the NVMe controller. Therefore, N2C time reported by blkparse is categorized as device time. We also break down the I/O access latency of SATA devices in a similar fashion. Since the SATA stack is well instrumented for this purpose, we do not need to add additional tracepoints.
3.2 Software Stack Overheads
Using the instrumentation tools described previously, in this section, we provide analysis and breakdown of the time spent in different sections of the I/O software stack and the device for SATA-based HDD/SSD, as well as the NVMe SSD. The devices used in our study can be found in Table1.
| Name | Desciption |
|---|---|
| Processor | Xeon E5-2690, 2.9GHz, dual socket-8 cores |
| HDD Storage | 1× 15K SAS Enterprise disk |
| SSD Storage | 4× Samsung 843 Pro SATA SSD (Samsung2013) |
| NVMe Storage | 1× Samsung XS 1715 NVMe (Samsung2014) |
| Memory Capacity | 64 GB ECC DDR3 R-DIMMs |
| Memory Bandwidth | 102.4GB/s (8 channels of DDR3-1600) |
| RAID Controller | LSI SAS 2008 (up to 290,000 IOPS) |
| Network | 10 Gigabit Ethernet NIC |
| Operating system | Ubuntu 12.04.5 |
| Linux Kernel | 3.14 Mainline |
| FIO Version | 2.1.10 run with direct I/O |
| HammerDB version | 2.16 |
| MySQL version | 5.5 |
| Cassandra version | 2.0.9 |
| MongoDB version | 2.6.0 |
Table 1: Server node configuration.
Figure3 shows a breakdown of the time spent by each request in different sections of the I/O software stack for random read latency at low load - 1 request per second.
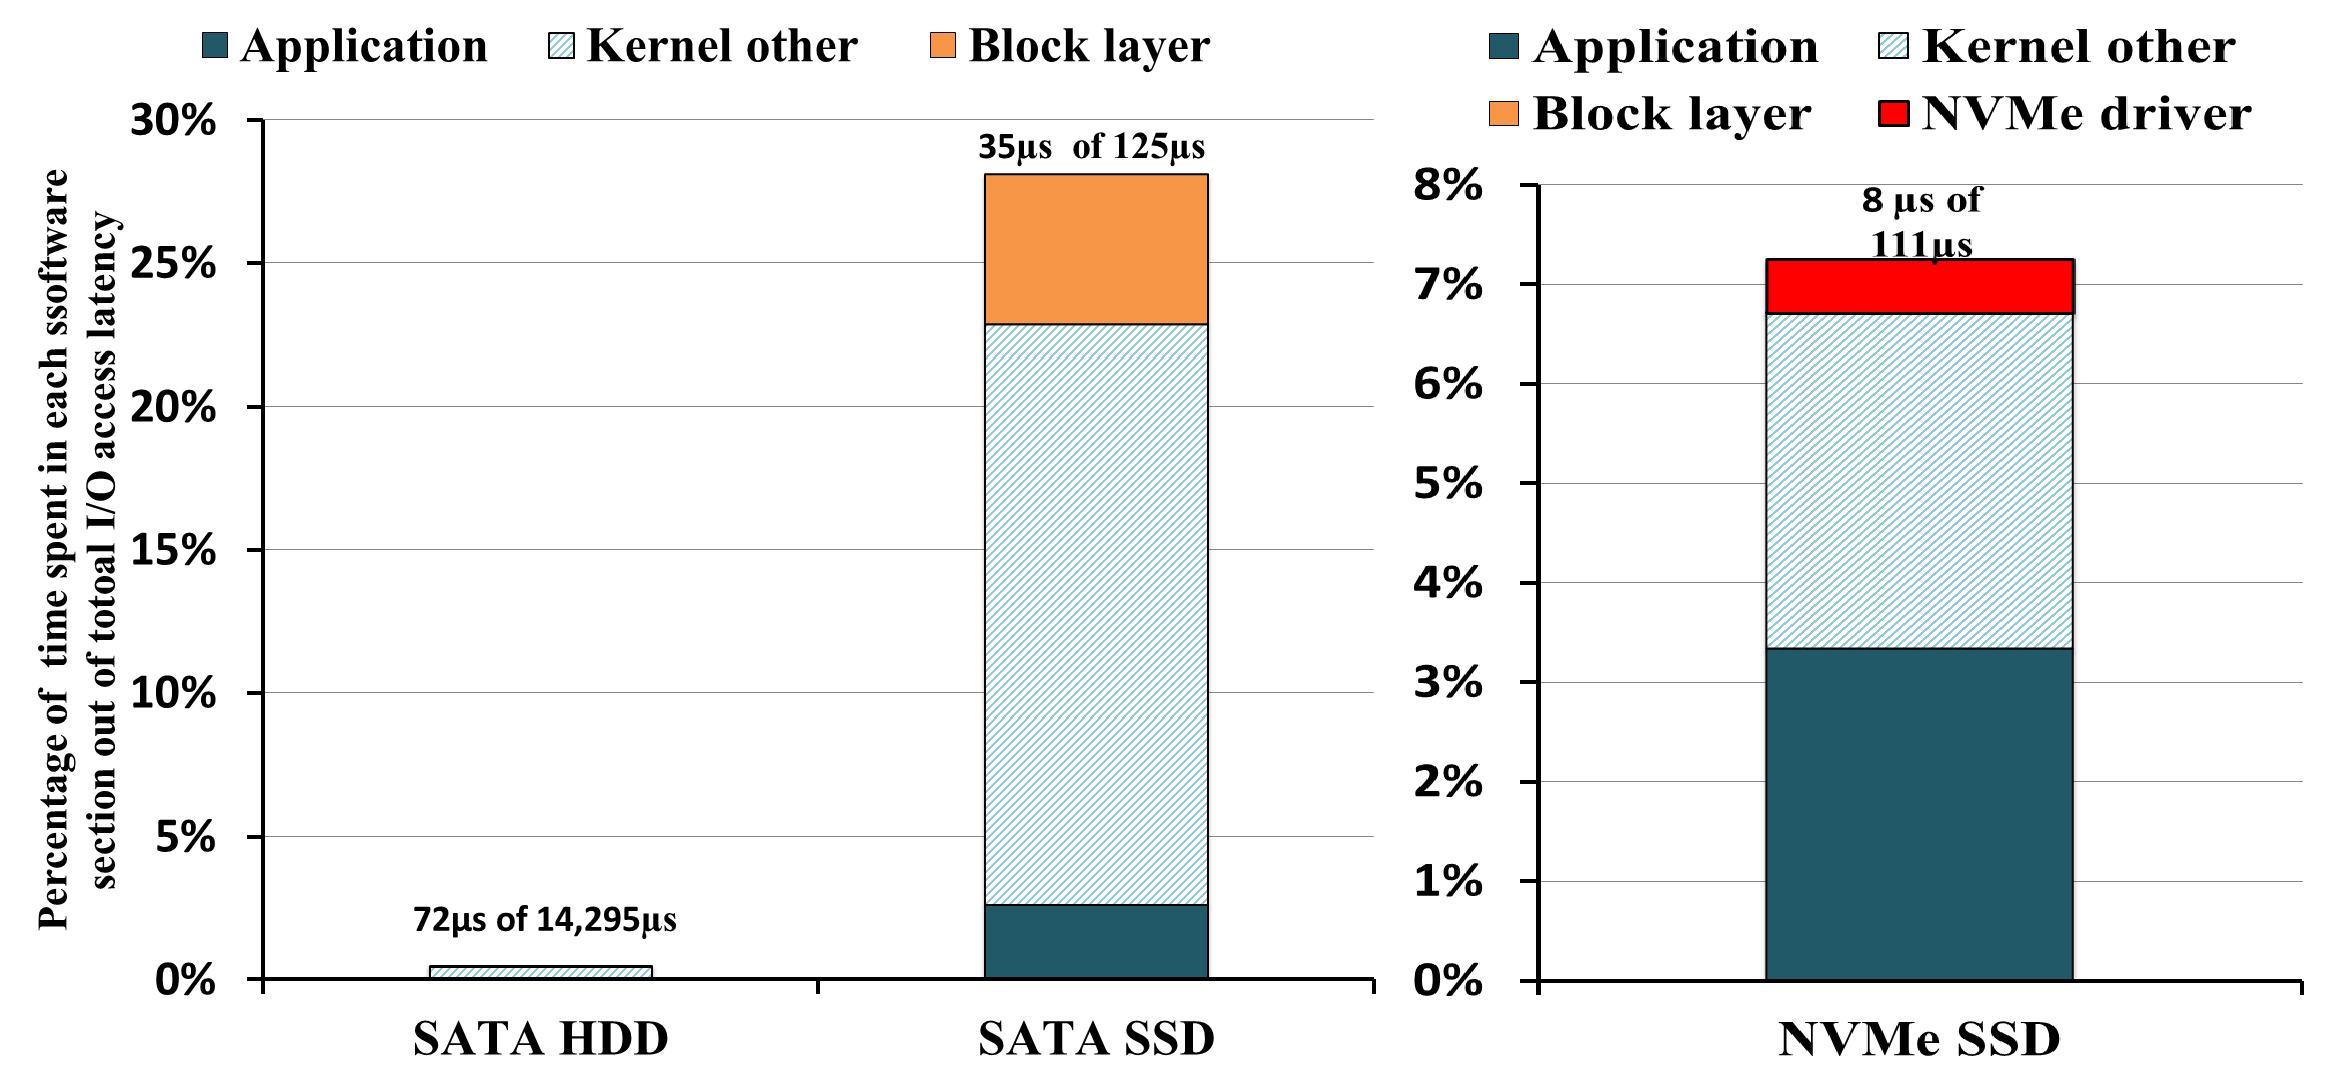
Figure 3: Break-down of the time spent in different sections of the I/O software stack.
Recall that since the SATA I/O stack was optimized for HDDs it assumed much larger device latencies than SSDs. Consequently, while the software overhead for HDD is only 0.5%, it accounts for 28% of the overall access latency in SATA SSD; the block layer alone accounts for 5% of the total latency. Indeed, the re-design of the software stack in NVMe was done to reduce these large overheads. As shown in the figure, the total software overhead in NVMe accesses is significantly reduced to 7.3%. The block layer access latencies are minuscule. The access latency of the NVMe driver itself is about 0.6µs, which accounts for 0.6% of total access latency.
The significant reduction of software overhead in NVMe over SATA can be explained based on its call-graph as shown in Figure1(b). For each SATA device, requests need to acquire a single lock to the request queue corresponding to the device. This is a major source of contention (FusionIO 2014a). All I/O requests from the host to the storage device, irrespective of the process, need to obtain the lock in order to read/write to the device. An NVMe device uses its large pool of NVMe queues to provide higher levels of I/O parallelism. Once the CPU writes a command to the tail of the SQ, the CPU side finishes the I/O request and can continue servicing other requests. However, for the SATA device, CPU is responsible to pass the request through several functions before the command is finally issued to the device. Thus, the NVMe driver helps reduce the CPU time spent to issue an I/O request.
3.3 Device Bandwidth and Access Latencies
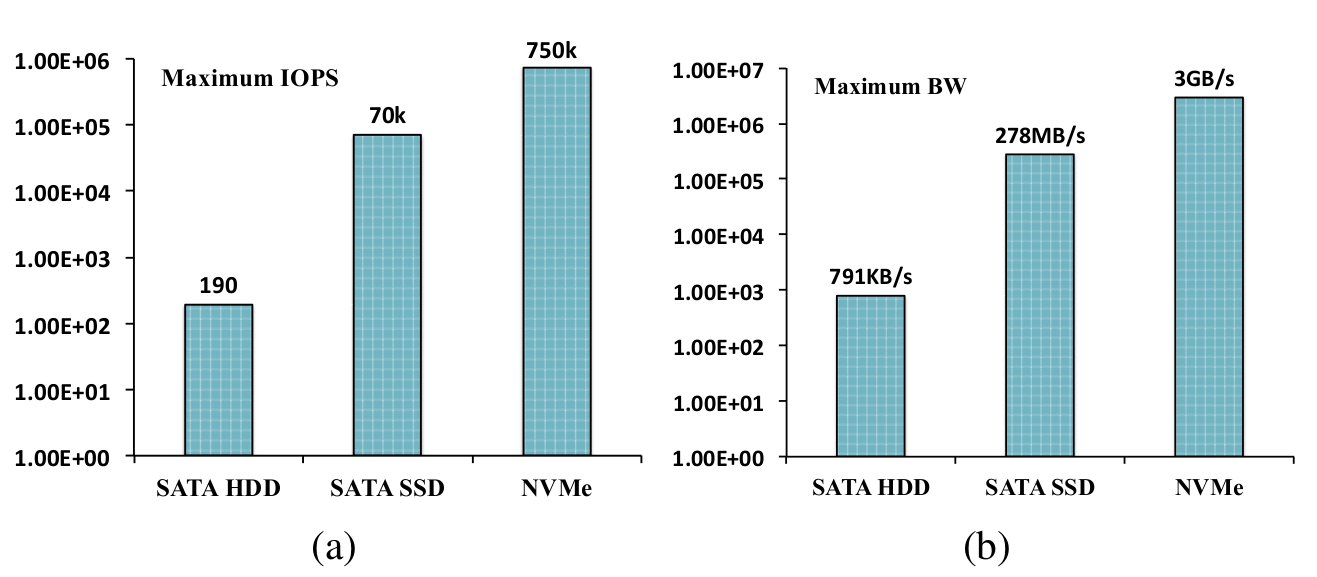
Figure 4: Measured (a) Maximum IOPS and (b) Maximum bandwidth for SATA HDD, SATA SSD, and NVMe SSD.
Figure4 shows the maximum bandwidth and IOPS for 4 KB random read accesses. We observe an enormous increase in throughput from 190 IOPS on HDD to about 70K IOPS on SSD. By breaking interface bottlenecks, innovation in FTL design, and better device characteristics, modern NVMe devices sustains maximum throughput of 750K IOPS.
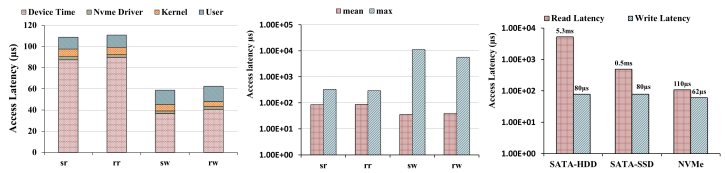
Figure 5: (a) Latency breakdown (b) Mean and max latencies for sequential read, random read, sequential write, and random write accesses (c) Read/write latency comparison for SATA HDDs, SATA SSDs and NVMe SSDs.
Figure5(a) shows the average access latencies for sequential read, random read, sequential write and random write accesses measured with FIO using queue depth of 8, running 4 parallel I/O jobs with 4 KB block size. Due to the seek time and rotational latency, random accesses on rotational hard disks are orders of magnitude higher than sequential access. However, on SSDs, there’s not much difference between random and sequential accesses. Both random and sequential addresses will be translated from Logical Block Address (LBA) into Physical Block Address (PBA) based on different wear leveling mechanisms, thus the sequentiality of the address may not be maintained. Consequently, as shown in Figure5(a), the total access latencies as well as latency decompositions are the same for both random and sequential accesses. The breakdown of latencies shows that for reads, approximately 80% of the total time is spent in the device while for writes, 64% of the access time is spent in the device. The absolute overhead of the application, OS, and driver is constant for reads and writes, and is approximately 23µs. The breakdown of time between driver, kernel and user time is also similar among reads and writes, with driver, kernel and the user program accounting for 2-3µs, 6-7µs and 14-15µs, respectively. Another notable characteristic that can be observed is that write speeds are faster than read speeds at low load. The primary reason for this is that all modern SSDs have a DRAM buffer where all writes are committed. Conversely, the read access is almost always bound by the time taken to access the flash chips.
Figure5(b) compares the average access latency with the maximum access latencies. Depending on the device controller design and the addressing mechanism etc, the access latency is not always a deterministic value but shows a stochastic distribution. Maximum latency can be orders of magnitudes higher than the average latency, which is shown in the write access latencies. This is attributed to Garbage Collection (Hu et al.2009), and wear-leveling mechanisms deployed in SSDs for improving device endurance.
Figure5(c) shows the comparison of random read and random write latencies between SATA-HDD, SATA-SSD and NVMe SSD under low load (1 access per second). The access latency of SATA-HDD is 5.3ms while the SATA-SSD random read access latency is only 0.5ms. NMVe SSD still shows the best random read access latency at 90µs. Since most writes to HDD, SSD, and NVMe devices are written to the RAM, write latencies are only ∼80µs for HDD and SATA SSD and 62µs for NVMe.
4 DBMS Performance Evaluation
NVMe drives are expected to be deployed in deta centers (Hoelzle and Barroso2009) where they will be used for I/O intensive applications. Since DBMSs are a prime example of I/O intensive applications for datacenters, this section characterizes the performance of several NVMe-backed DBMS applications. We study both relational (MySQL) and NoSQL databases (Cassandra and MongoDB), and compare NVMe performance with SATA-SSDs in multiple configurations. We show that superior performance characteristics of NVMe SSDs can be realized into significant speedups for real-world database applications.
Production databases commonly service multiple clients in real-world use-cases. However, with limited cluster resources, we experiment with a single server-client setup. All pertaining experiments are based on a dual-socket Intel Xeon E5 server, supporting 32 CPU threads. We use 10GbE ethernet for communication between the client and server. Server hardware configuration is representative of typical installations at major datacenters. Further details on the hardware and software setup can be found in Table1. We use TPC-C (TPC2010) schema to drive the MySQL database, and YCSB (Cooper et al.2010) to exercise NoSQL databases.
We support three storage configurations for all our experiments. Our baseline performance is characterized on a single SATA SSD. In addition, we set up four SSDs in RAID0 configuration using a hardware RAID controller. This configuration enables us to understand performance impact related due to bandwidth improvements, as it provides much higher aggregated disk throughput (over 2GB/s) but does little to reduce effective latency. Finally, we compare both SSD configurations to a single NVMe drive and analyze its impact on performance.
4.1 Relational Databases: TPC-C
TPC-C (TPC2010) is an online transaction processing (OLTP) workload that simulates a complex application environment. It is composed of several read-only and update- intensive operations, and represents a wholesale business that manages, sells, and distributes a product to a large set of customers.
The TPC-C workload is organized as warehouses within a company, where each warehouse includes a predefined number of districts and customers. It supports five representative transactions: two are strictly read-only, while three perform both read and write access (Dell2013). All transactions operate against a database of nine tables; the workload also defines the overall distribution of transactions and their response time requirements (TPC2010). TPC-C measures the number of new orders processed per minute, and the metric is expressed in transactions-per-minute (tpmC).
4.1.1 TPC-C Experimental Setup and Optimizations
We use HammerDB (HammerDB2014) to generate the schema and transactions and MySQL (Oracle2014) as the underlying database.
Our initial setup and experiments indicate sub-optimal performance on stock installation of MySQL, thereby prompting the need to identify and optimize several parameters. In interest of space, we only summarize four key parameters that had the most impact on performance:
- Concurrent Connection Limit: We set the number of concurrent connections supported in MySQL and the number of open file descriptors in the Linux kernel to 32K.
- I/O scheduler: We use the noop Elevator scheduler (see Section2) to gain optimal SSD performance.
- Thread Concurrency: Mumber of concurrent threads inside MySQL’s storage engine (InnoDB) is set to match the maximum supported CPU threads (32).
- Buffer Pool Size: We use a buffer pool size of 8 GB for caching InnoDB tables and indices.
We initialize the database with 1024 warehouses, resulting in a 95GB dataset. As mentioned in section4, we experiment with a single SSD and a four SSD setup. The SSD experiments are subsequently compared with a single NVMe drive, and a RAM-based tmpfs filesystem.
4.1.2 TPC-C Performance Evaluation
We use timed test driver in HammerDB and measure results for up to six hours. To establish a stable TPC-C configuration, we first explore the throughput of TPC-C system by scaling the number of virtual users (concurrent connections), as shown in Figure6. While maximum throughput is achieved at ten virtual users, increasing concurrency past that point leads to a sharper fall in throughput. We observe more consistent performance between 60-65 virtual users. Based on these sensitivity results, we select 64 virtual users for all experiments.
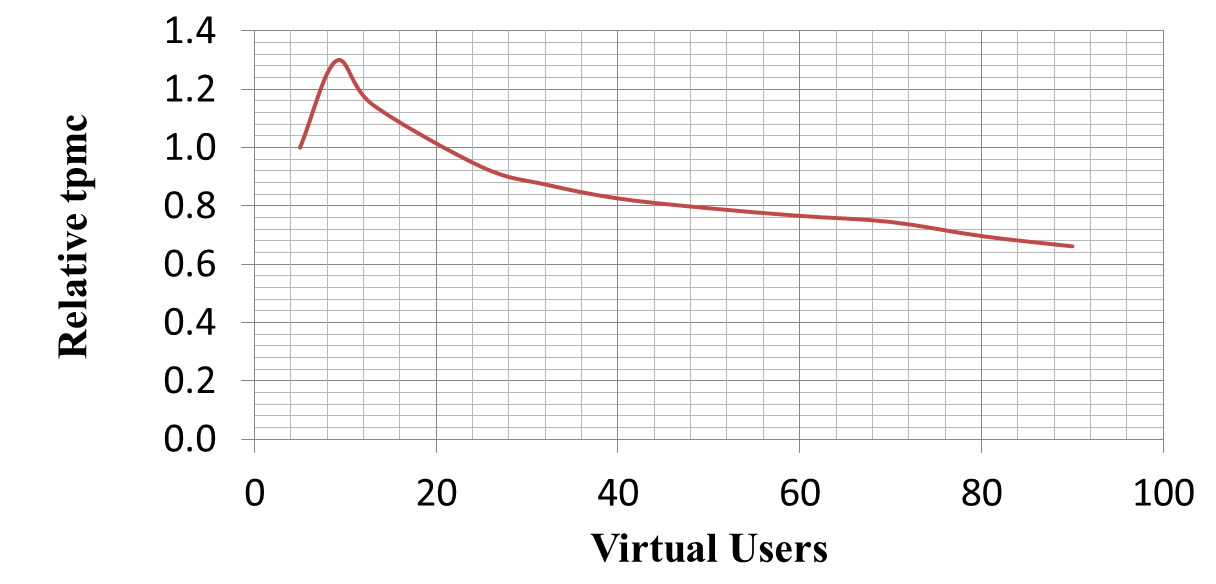
Figure 6: TPC-C performance sensitivity with virtual users
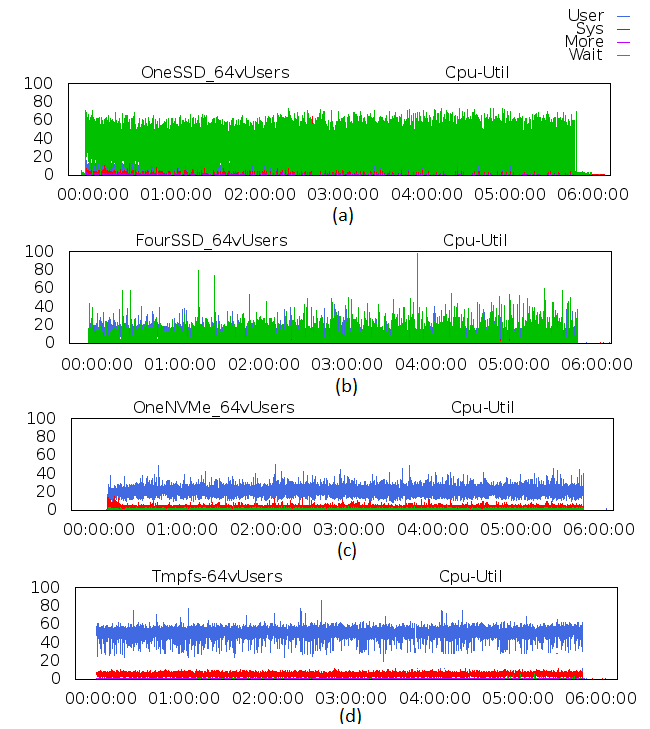
Figure 7: CPU utilization for TPC-C with: (a) One SSD drive (b) Four SSD drives (c) One NVMe drive and (d) Tmpfs
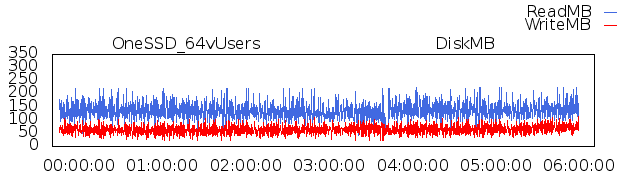
Figure 8: TPC-C disk bandwidth with one SSD drive
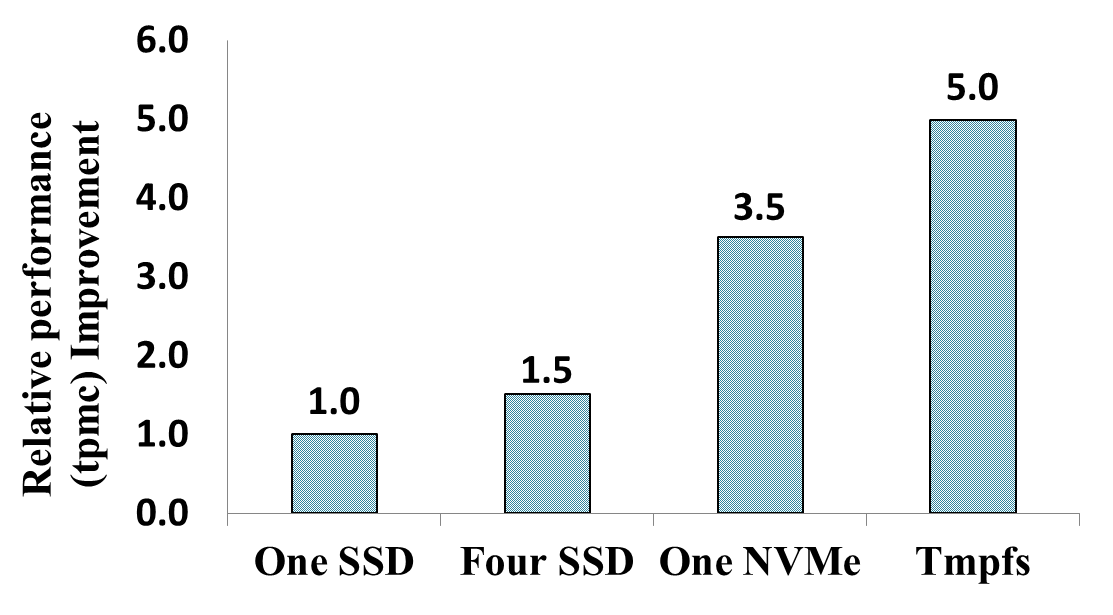
Figure 9: TPC-C performance improvement with SSD, NVMe and Tmpfs
TPC-C is a disk intensive workload, and is characterized as a random mix of two reads to one write traffic classification (Dell2013). While it mostly focuses on the overall throughput metric, lower latency storage subsystem reduces the average time per transaction, thus effectively increasing the overall throughput. Figure7 shows the I/O latency impact on effective CPU utilization for all four previously described experimental categories. As shown in the figure, for the baseline single-SSD configuration, the system spends most of its time in I/O wait state. This limits the throughput of the system as CPU spends the majority of its execution cycles waiting on I/O requests to complete. Figure8 shows the disk read and write bandwidth for the SSD configuration, with writes sustaining at about 65 MB/s and reads averaging around 140 MB/s. While NAND flash has better latencies than HDDs, write traffic requires large management overhead, leading to a significant increase in access latencies for read/write mixed traffic. The trend exacerbates for traffic with increasing amount of randomness and write ratio.
Figure7(b) shows that striping disk traffic across four SSDs reduces the I/O wait times signficantly. Distributing traffic across four SSDs reduces total number of accesses per SSD leading to reduced access latencies. The lower latency translates into lower I/O wait times and increased user-level activity. As shown in Figure9, this results in about 1.5× throughput (tpmc) improvement We also see a similar increase in disk read and write bandwidth.
The NVMe SSD, (Figure7(c)) shows minimal I/O wait times and significantly higher sustained user-level activity at around 30%. As described earlier in section3.3, native NVMe latencies are much lower than their SATA counter-parts due to hardware and software interface and protocols. Our experimental results show increased user-level activity with one NVMe drive leads to 3.5× increase in performance over the baseline, as shown in Figure9.
In order to further understand the impact of storage latency, we experiment with tmpfs (Snyder1990) - a temporary file system mounted on DRAM. DRAM access latencies are around three orders of magnitude lower than that of NAND flash, and support maximum bandwidth of 12.8 GB/s per channel (DDR3-1600). Figure7(d) shows that tmpfs-based experiment results in sustained user-level activity of around 60%, with almost no visible I/O wait states. As shown in Figure9, this results in a 5 × performance gain over
a single SSD. While tmpfs based experiment yeilds highest throughput, performance benefits are limited in comparison to the magnitude of reduction in latency and the bandwidth increase realized by using tmpfs. It is also important to note that tmpfs is a volatile storage volume mostly used as temporary storage. Hence, tmpfs filesystems only serves as a proxy to understand theoretical upper limits on performance.
4.2 Cassandra
Cassandra is an open-source, NoSQL data store, that gained widespread adoption in the last few years. Companies such as Netflix, WalmartLabs, Digg and Twitter use Cassandra in production (Datastax2010). It has been primarily designed and optimized for fast writes and “scale-out”: Cassandra throughput will (theoretically) scale linearly when new nodes are added to the cluster.
In this section we explain some of the important data structures of Cassandra to motivate discussion of their effects on performance. Cassandra, by design, is optimized for writes (FusionIO2013). Any data written to Cassandra is written in parallel to (1) the memtable - a DRAM resident cache; and (2) to the commit log - a disk resident data structure (DataStax2014; FusionIO2013). When the memtable content exceed a certain threshold, it is flushed to disk, creating an SSTable. Since Cassandra does not update data in-place, the updated data will be written to a newer SSTable rather than the SSTable containing the original data. Since Cassandra is “eventually consistent“, the writes to the commit-log (which typically resides on a different disk than the data disk), are not on the critical path for write completion. In contrast to writes, reads in Cassandra have a longer datapath if they miss the memtable. Since data can exist in multiple SSTables, all possible locations need to be checked before the latest data is returned. In order to reduce frequent multiple lookups, Cassandra performs periodic compaction of SSTables that merges and consolidates different SSTables into a single SSTable.
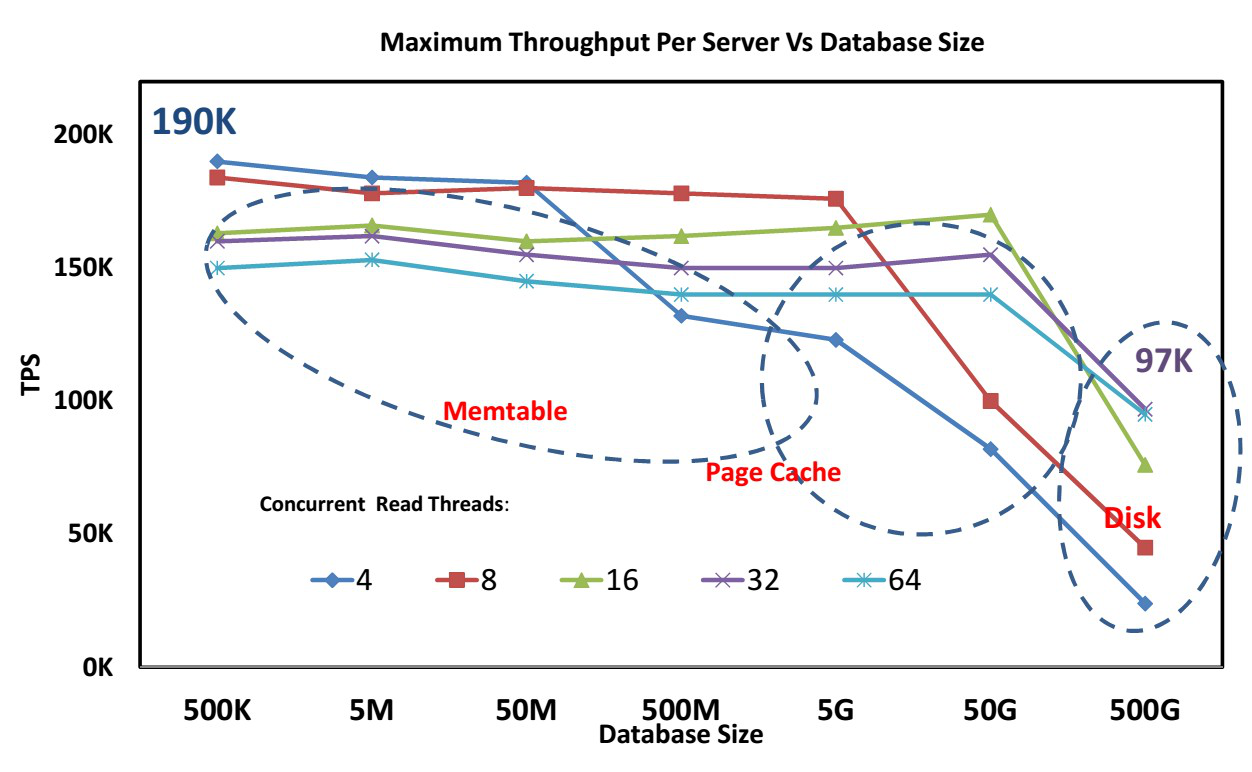
Figure 10: Comparison of Cassandra performance for different database sizes with NVMe SSD as the storage media.
To provide better insight into the size of Cassandra data structures, the database size and Cassandra performance, we experimented with the YCSB C (100% reads) workload. We varied the database size and number of concurrent threads for the Cassandra server while using NVMe drive for data. The result of this experiment is shown in Figure10. The Memtable size is set to 1GB, and the page cache management is left to the OS. The size of the Memtable determines the frequency of flushes to the drive, and the total number of on-disk SSTables affects read performance. We observe two distinct performance effects in the figure. In the first case, the database size is small and the complete database fits in the Memtable. In this case, lower number of concurrent read threads lead to better performance. Since all the data is served by DRAM, the bottleneck in the system is the context switching and synchronization overhead of concurrent threads. As the database size increases, the NVMe disk (with an order of magnitude larger latency than DRAM), is used more frequently. In this case, the Cassandra server with larger thread count has better performance as it is able to hide the latency effectively keeping throughput constant. Therefore, while the performance of Cassandra with 4 read threads and 8 read threads drop, the 16, 32, and 64 threads instances have constant performance. To mitigate the overheads of context switch all subsequent Cassandra experiments have been done using 32 concurrent threads, which matches the number of hyperthreaded cores that the CPU supports. The second important effect is observed when we increase the database size beyond the size of the PageCache. In this case, the performance of all instances drop because of increased use of the NVMe disk. From the above two observations we can conclude that the performance of Cassandra is heavily dependent on the installed DRAM capacity and also the read latency and throughput performance of the storage for read intensive benchmarks. This observation is reinforced on comparison of Cassandra performance among different storage media.
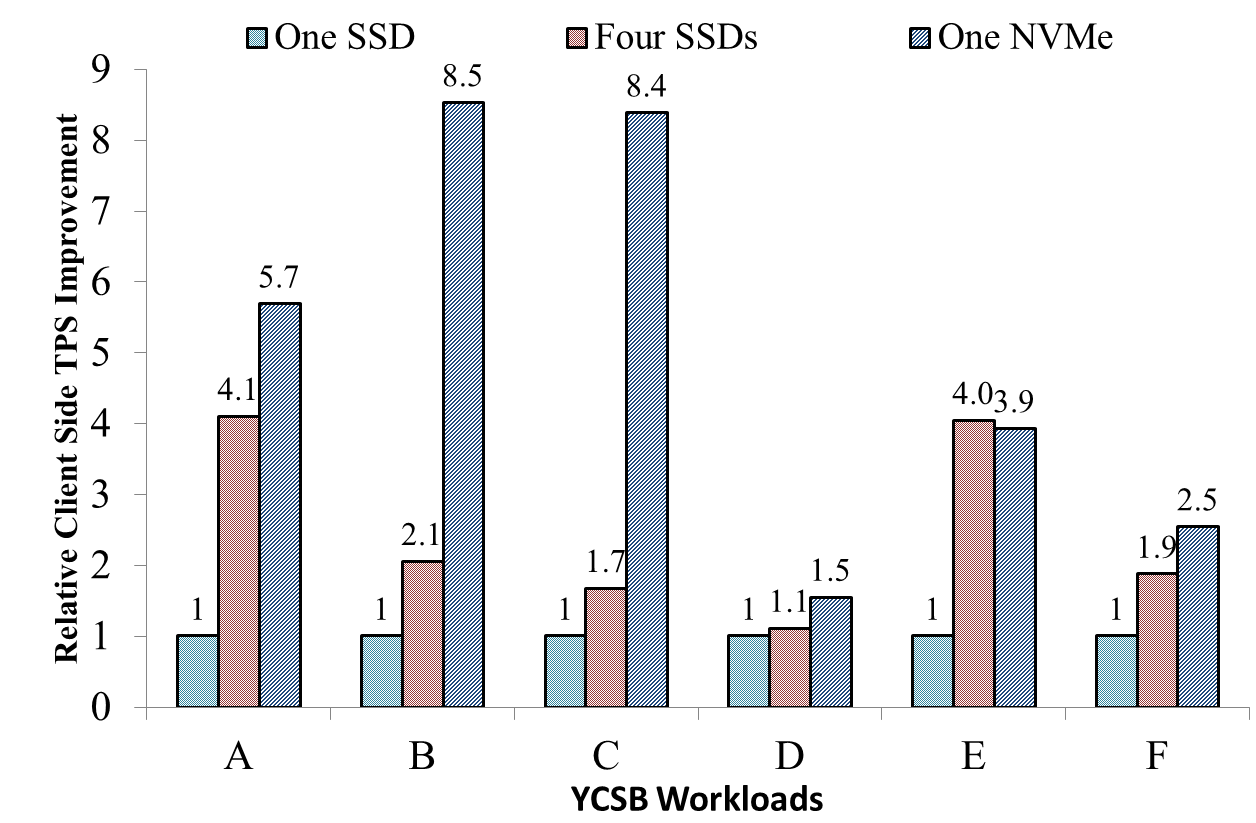
Figure 11: Comparison of Cassandra performance for different storage media.
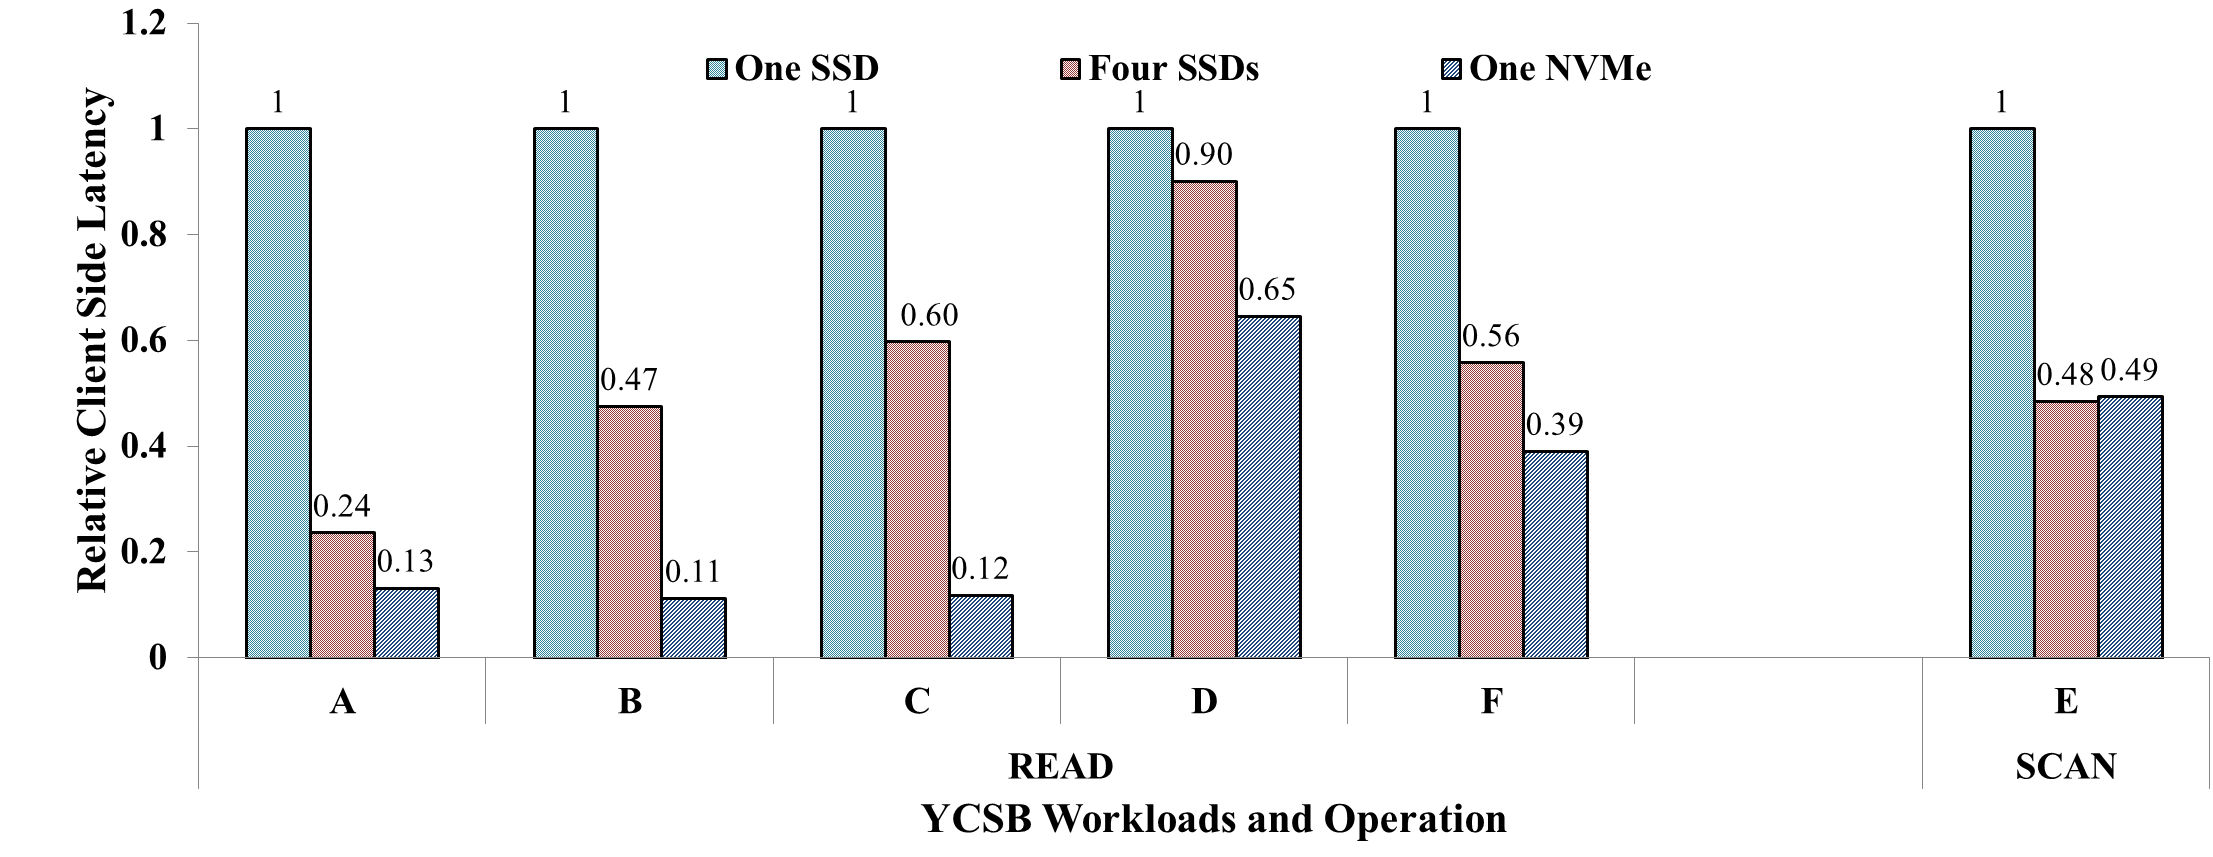
Figure 12: Comparison of Cassandra client side latency for different storage media.
Figure11 compares Cassandra performance when configured with 1 SSD drive, 4 SSD drives on RAID0, and 1 NVMe drive for all 6 YCSB workloads. NVMe performance improvements over SSD range from 55% in workload D to a whopping 8.34X in workload C. Recall that writes (inserts) and updates happen in DRAM while reads missing the memtable cache are serviced by multiple SSTables that reside on disk. Indeed, NVMe speedups are most profound in read-heavy workloads (workloads B, and C) and are modest in write-heavy workloads (workload A) and workloads with many read-modify-writes (workload F). The primary reason why workload D does not show significant improvement is because workload D has the latest distribution and has great cache characteristics. Also, since workload E (scans) reads large chunks of data, it benefits from data striping in RAID0.
Figure12 compares the client side read latencies of different storage media (We only show comparison of read latencies in this figure with the exception of workload E that shows SCAN latency). The reason for not showing update and insert latencies is that they are relatively the same across all media. A possible reason for that is that all storage media considered in this paper have a DRAM buffer and all writes to the storage are committed to the storage device DRAM. It can also be observed that the throughput benefits for Cassandra correlates well with the corresponding latency benefits. Workloads B and C have the lowest relative latency for NVMe compared to SATA SSD (11%-13%), and they show the best benefits in throughput. Another interesting data-point in the figure is the one showing scan latency in workload E. This latency is almost the same for NVMe drive and RAID0 SSD drives. The throughput of NVMe for workload E is also very close to that of four RAID0 SSDs.
The Cassandra server running YCSB does not come close to saturating the bandwidth offered by the NVMe drive. For Cassandra, the bottlenecks of operation are either with the software stack or I/O latency. For the NVMe drive case, the peak disk bandwidth is 350MB/s, while the one SSD Cassandra instance can barely sustain 70MB/s. Further investigation into the CPU utilization for the one SSD instance reveals that a good amount of time is spent in waiting for I/O operation. In contrast, the NVMe instance has negligible I/O wait time. This observation further points to the fact that Cassandra read TPS performance is very sensitive to the read latency of the storage media. Also, the benefits demonstrated for Cassandra using NVMe drives are primarily due to lower read latency of NVMe drives.
4.3 MongoDB
MongoDB is another increasingly popular NoSQL data store. MongoDB uniqueness stems from the fact that it follows a document model for storing records. Each record in MongoDB is a collection (data structure) of field-value pairs, very similar to a JSON-like representation. The values themselves can be other documents, or a collection of documents (MongoDB2014b). Data for a MongoDB database is stored as collections - an array of row-column style tables. A collection holds one or more documents, which corresponds to a row in a relational database table. Each document has one or more fields, which corresponds to a column in a relational database table (MongoDB2014b).
4.3.1 MongoDB Performance Considerations
While the internals of MongoDB are beyond the scope of this work, an understanding of the basics is needed to better explain the results in later sections. MongoDB strives for better performance using memory mapped I/O (MongoDB 2014a,c,d). Memory mapped I/O allows for mapping files to virtual memory of the processor. The entire database is stored on disk by splitting it into a number of small sized data files, with the size of these files ranging from 64 MB to 2 GB. As and when these files are accessed by the storage engine, they are memory mapped using mmap(). This allows MongoDB to behave as if the working set is DRAM resident.
4.3.2 MongoDB Performance Analysis
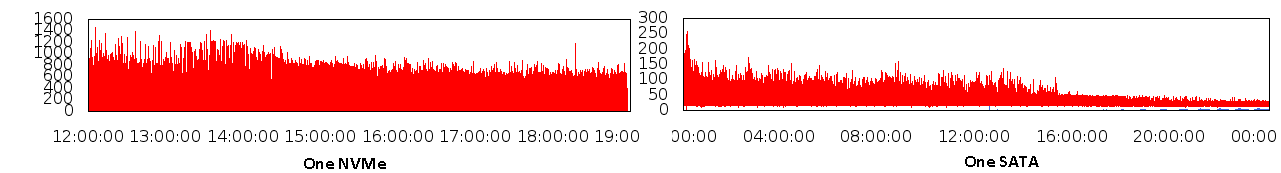
Figure 13: Comparison of disk bandwidth utilization for Load phase of MongoDB benchmarking.
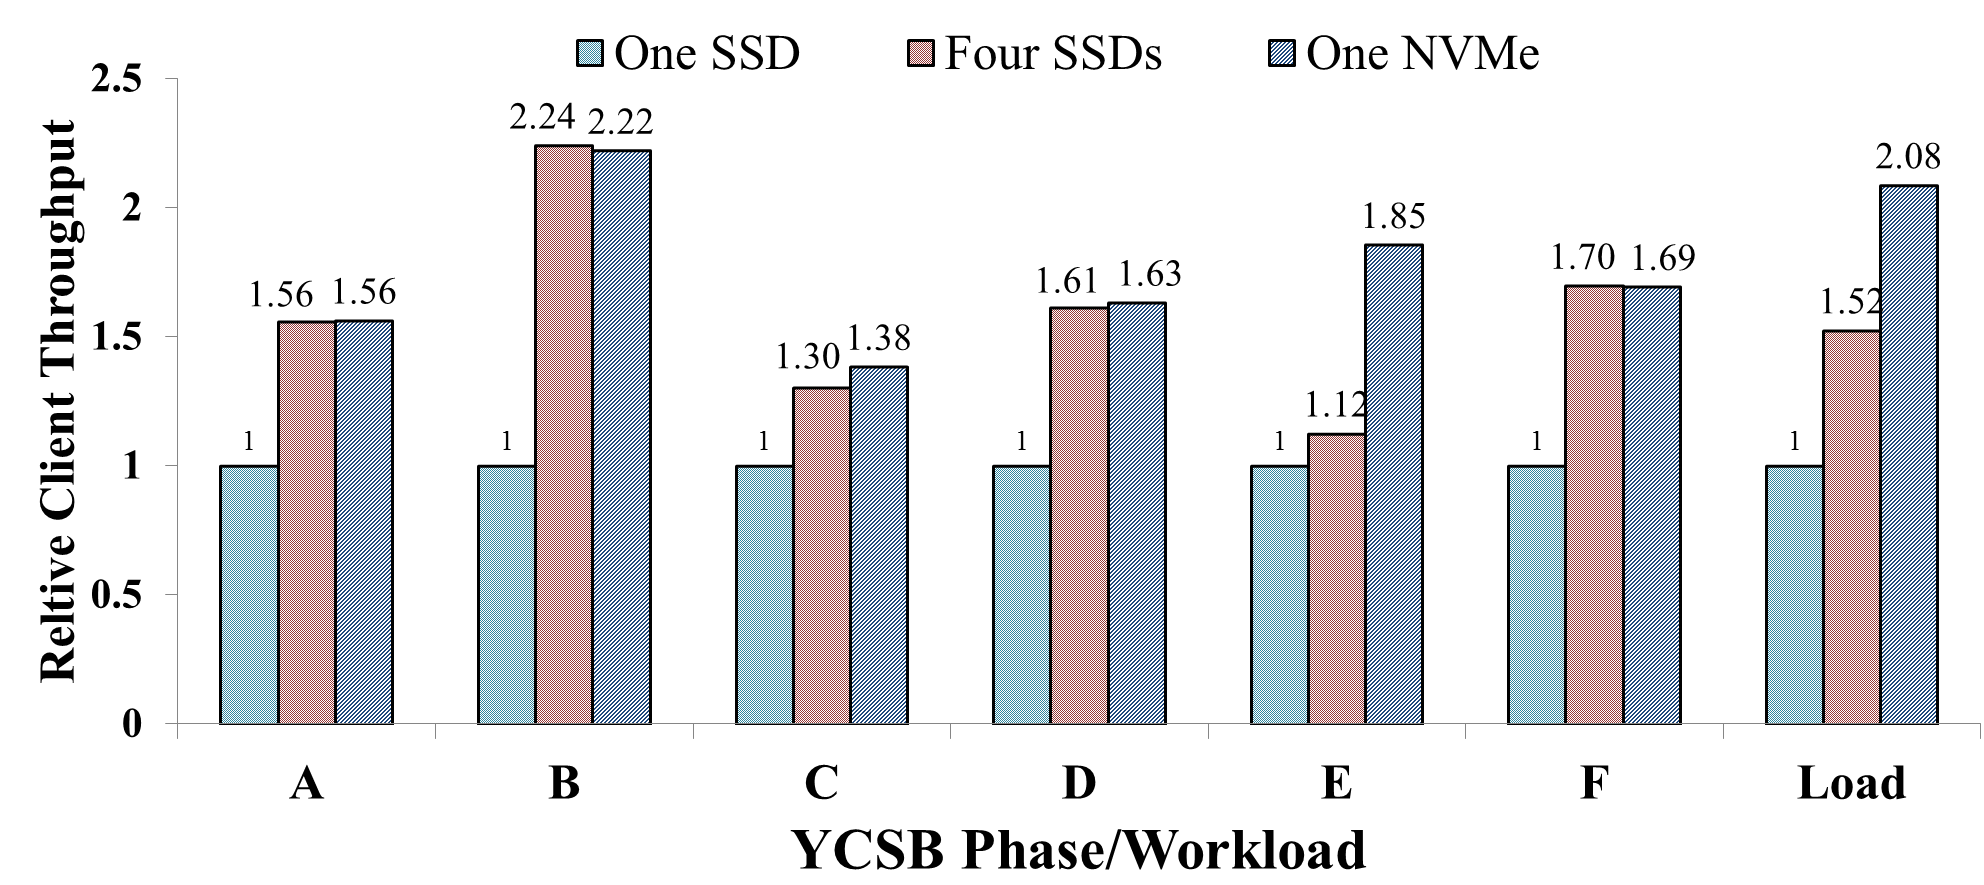
Figure 14: Comparison of MongoDB performance for different storage media.
Since MongoDB uses memory mapped I/O, the dependence of the application on the storage subsystem is not as pronounced as in the previous cases. Nevertheless, there are distinct benefits of having NVMe drives in certain cases. Figure14 presents the relative client side performance results for three storage configurations considered in this paper. The benefit of NVMe drives is evident in cases where disk performance dictates system performance, i.e. workload E (SCAN intensive) and Load phase (write intensive). Figure13 compares the disk bandwidth utilization during the Load phase of YCSB execution. As is evident, the NVMe drive is able to sustain 3× higher write bandwidth compared to the SATA SSD, leading to an overall 2× increase in throughput. Moving from a single SSD to a RAID0 configuration helps performance, but not as much as a single NVMe SSD. Similar behavior is observed for workload E, which is SCAN intensive and requires sustained read bandwidth. As compared to the 4 SSD RAID0 configutation, the NVMe drive performs 65% and 36% better for the Load phase and workload E, respectively. For the rest of the YCSB workloads, owing to memory mapped I/O, the performance of NVMe SSD is very similar to that of RAID 0.
5 Related Work
In this section, we describe some of the work related to performance characterization of SSDs, industrial storage solutions and system software optimizations for I/O.
5.1 Software Stack Bottlenecks and Remedies
With improvements in storage device technology, the once negligible cost of I/O stack time has become more relevant (Foong et al.2010; Caulfield et al.2010). A number
of studies have provided proof of the I/O software stack being the major performance bottleneck in future storage systems. Yu et al. (Yu et al.2014) analyzed system software overheads and propose six optimizations that enable operating systems to fully exploit the performance characteristics of storage devices based on non-volatile media. They proposed using polling over interrupts, bypassing the I/O scheduler for certain types of requests, and using an asynchronous I/O path, among other optimizations. Along similar lines, Yang et al. (Yang et al.2012) make a case for allowing synchronous completion of certain types of I/O requests, to avoid the kernel’s asynchronous software stack. They argue for a solution with both synchronous and asynchronous paths for block devices:
Synchronous one is used for small, frequent transfers, while the asynchronous one for large, infrequent ones. In a recent study, Swanson et al. (Swanson and Caulfield2013) analyzed the overheads of the software I/O stack. They show that for a 4KB access to HDD, the Linux software stack accounts for only 0.3% of the total access time. The contribution of the software stack to the access latency for the same 4KB access on a prototype SSD was 70%. Bjørling et al. (Bjørling et al.2013) show the inefficiencies of the Linux I/O block layer, especially because of the use of locks in the request queue. They propose a design based on multiple I/O submission and completion queues in the block layer. Their optimizations have been recently included into the Linux kernel (Larabel2014).
The Linux’s I/O subsystem exports a number of knobs that can be turned to get most performance out of a given set of hardware resources. A number of I/O schedulers (Corbet2002; J. Corbet2003) have been developed in the recent past for different storage devices. The Noop scheduler (Rice 2013) was developed specifically to extract the maximum performance out of SSDs. Pratt and Heger (Pratt and Heger 2004) showed a strong correlation between the I/O scheduler, the workload profile and the file system. They show that I/O performance for a given system is strongly dependent on tuning the right set of knobs in the OS kernel. Benchmarks (Axboe2014) and tools (Axboe and Brunelle2007) have been very useful in analyzing the I/O software stack.
5.2 NVMe Standard
A number of documents (NVM-Express2012; Huffman 2012; Walker2012) provide some details into the implementations of the standard as well as its qualitative benefits over the existing standards, but there is a dearth of literature providing quantitative insights. Busch (Busch2013) provides details about the NVMe driver implementation. Huffmann et al. (Huffman, A. and Juenemann, D.2013) provide more details on NVMe core features and discuss its scalability for next generation NVM devices with latencies orders of magnitude lower than NAND SSDs. They also discuss accelerating NVM adoption through Hybrid Storage Solutions.
5.3 Industrial Solutions
There has been increasing interest in developing efficient and better storage solutions for Cloud and Hyperscale databases. Recently, SanDisk has developed a hardware- software solution for scaling Cassandra (SanDisk2013). SanDisk proposes a solution to scale Cassandra by allowing custom SanDisk software (Zetascale) that utilizes idle cores to execute threads for generating data accesses to the SSDs. This allows for better utilization of the CPU cores, as well as extracts the maximal benefit from the SSD by increasing utilization. However, this solution is intrusive in the sense that it requires custom software to be installed on the servers. Sim-ilarly, Fusion-IO recommends using faster and denser PCIe SSDs (FusionIO2013) to store Cassandra’s database files.
SanDisk’s MongoDB solution (SanDisk2014) revolves around using Zetascale to accelerate accesses to the databases. On the other hand, the Fusion-IO solution (FusionIO2014b) proposes to use the fast and dense flash memory to be extended into a larger address space alongside DRAM using their ioMemory product.
6 Conclusions
Scale-out systems are driving the need for high performance storage solutions with high available bandwidth and lower access latencies. To address this need, newer standards are being developed exclusively for non-volatile storage devices like SSDs. In this paper, we present the first, detailed analysis and characterization of SSDs based on the Non Volatile Memory Express (NVMe) standard for storage subsystems, and make a number of important contributions.
Firstly, we show that there is tremendous benefit to be had from re-architecting the existing I/O stack of the operating system. We instrument the Linux NVMe driver and the popular blktrace tool to quantify the benefits of a leaner I/O stack. Using this methodology, we show that the NVMe access stack allows the I/O requests to bypass most of the legacy I/O layers, resulting in a 4× decrease in system software overheads. Secondly, using synthetic benchmarks, we also verify the rated, raw performance of the NVMe SSDs (The 3.17 linux kernel has a re-architected block layer for NVMe drives based on (Bjørling et al.2013). NVMe accesses no longer bypass the kernel. The results shown in this paper are for the 3.14 kernel). Lastly, using databases as an example class of applications, we show that NVMe’s hardware and software redesign of the storage subsystem translates into real-world benefits for a number of scale-out database applications. In particular, we show that, as compared to a single SATA SSD, NVMe based SSDs can provide performance benefits of up to 8×. Furthermore, we show that one NVMe based SSD can outperform a RAID 0 configuration comprising of four SATA SSDs by up to 5×. Therefore, a better hardware interface, simpler hardware datapath, and a simpler stack, enable NVMe drives to demonstrate exemplary performance for real world database applications compared to SATA SSDs. The database application performance benefits would enable a wider adoption of NVMe SSDs in enterprise and cloud datacenters.
References
- J. Axboe. FIO. http://git.kernel.dk/?p=fio.git;a=summary, 2014.
- J. Axboe and A. D. Brunelle. blktrace User Guide. http://www.cse.unsw.edu.au/~aaronc/iosched/doc/blktrace.html, 2007.
- S. Bates. Accelerating Data Centers Using NVMe and CUDA. http://www.flashmemorysummit.com/English/Collaterals/Proceedings/2014/20140805_D11_Bates.pdf, 2014.
- M. Bjørling, J. Axboe, D. Nellans, and P. Bonnet. Linux block IO: Introducing multi-queue SSD access on multi-core systems. In Proceedings of SYSTOR, 2013.
- K. Busch. Linux NVMe Driver. http://www.flashmemorysummit.com/English/Collaterals/Proceedings/2013/20130812_PreConfD_Busch.pdf, 2013.
- A. M. Caulfield, A. De, J. Coburn, T. I. Mollow, R. K. Gupta, and S. Swanson. Moneta: A high-performance storage array architecture for next-generation, non-volatile memories. In Proceedings of MICRO, 2010.
- B. F. Cooper, A. Silberstein, E. Tam, R. Ramakrishnan, and R. Sears. Benchmarking Cloud Serving Systems with YCSB. In Proceedings of SoCC, 2010.
- J. Corbet. A new deadline I/O scheduler. http://lwn.net/Articles/10874/, 2002.
- Datastax. Companies using nosql apache cassandra. http://planetcassandra.org/companies/, 2010.
- DataStax. Cassandra – About the write path. http://www.datastax.com/documentation/cassandra/1.2/cassandra/dml/dml_write_path_c.html?scroll=concept_ds_wt3_32w_zj__about-the-write-path, 2014.
- Dell. OLTP I/O Profile Study with Microsoft SQL 2012 Using EqualLogic PS Series Storage. http://i.dell.com/sites/doccontent/business/large-business/en/Documents/BP1046_OLTP_IO_Profile_Study.pdf, 2013.
- F. X. Diebold. Big Data Dynamic Factor Models for Macroeconomic Measurementand Forecasting. In Eighth World Congress of the Econometric Society, 2000.
- A. P. Foong, B. Veal, and F. T. Hady. Towards SSD-Ready Enterprise Platforms. In Proceedings of ADMS at VLDB, pages 15–21, 2010.
- FusionIO. Fusion-io Flash Memory as RAM Relief. 2013.
- FusionIO. 1.1 a scalable block layer for high-performance ssd storage. http://kernelnewbies.org/Linux_3.13, 2014a.
- FusionIO. Fusion Power for MongoDB. http://www.fusionio.com/white-papers/fusion-power-for-mongodb, 2014b.
- HammerDB. Hammerdb, version 2.16. http://hammerora.sourceforge.net/, 2014.
- U. Hoelzle and L. A. Barroso. The Datacenter As a Computer: An Introduction to the Design of Warehouse-Scale Machines. Morgan and Claypool Publishers, 1st edition, 2009.
- X.-Y. Hu, E. Eleftheriou, R. Haas, L. LLiadis, and R. Pletka. Write Amplification Analysis in Flash-Based Solid State Drives. In Proceedings of SYSTOR, 2009.
- A. Huffman. NVM Express Revision 1.1. http://www.nvmexpress.org/wp-content/uploads/NVM-Express-1_1.pdf, 2012.
- Huffman, A. and Juenemann, D. The Nonvolatile Memory Transformation of Client Storage. Computer, 46(8):38–44, August 2013.
- J. Corbet. Anticipatory I/O Scheduling. http://lwn.net/Articles/21274/, 2003.
- K. Jo. Scaling from Datacenter to Client. http://www.flashmemorysummit.com/English/Collaterals/Proceedings/2014/20140805_A12_All.pdf, 2014.
- M. Larabel. SCSI Multi-Queue Performance Appears Great For Linux 3.17, 2014.
- MongoDB. MongoDB Storage. http://docs.mongodb.org/manual/faq/storage/, 2014a.
- MongoDB. MongoDB 2.6 Manual. http://docs.mongodb.org/manual/, 2014b.
- MongoDB. Mongodb - write operations overview. http://docs.mongodb.org/manual/core/write-operations-introduction/, 2014c.
- MongoDB. Performance Considerations for MongoDB. http://info.mongodb.com/rs/mongodb/images/MongoDB-Performance-Considerations_2.4.pdf, 2014d.
- NVM-Express. NVM Express Explained. http://nvmexpress.org/wp-content/uploads/2013/04/NVM_whitepaper.pdf, 2012.
- Oracle. Mysql, version 5.5. http://www.mysql.com/, 2014.
- S. L. Pratt and D. A. Heger. Workload Dependent Performance Evaluation of the Linux 2.6 I/O Schedulers. In Linux Symposium, Ottawa, Canada, July 2004.
- M. Rice. Tuning Linux I/O Scheduler for SSDs, 2013. URL http://dev.nuodb.com/techblog/tuning-linux-io-scheduler-ssds.
- Samsung. SM843 Pro Data Center Series. http://www.samsung.com/global/business/semiconductor/file/media/SM843_Brochure-0.pdf, 2013.
- Samsung. XS1715 Ultra-fast Enterprise Class 1.6TB SSD. http://www.samsung.com/global/business/semiconductor/file/product/XS1715_ProdOverview_2014_1.pdf, 2014.
- SanDisk. The SanDisk Solution for Scaling Cassandra. http://www.sandisk.com/assets/docs/The_Sandisk_Solution_for_Scaling_Cassandra.pdf, 2013.
- SanDisk. MongoDB Product Brief. 2014.
- P. Snyder. tmpfs: A virtual memory file system. http://wiki.deimos.fr/images/1/1e/Solaris_tmpfs.pdf, 1990.
- S. Swanson and A. Caulfield. Refactor, reduce, recycle: Restructuring the i/o stack for the future of storage. IEEE Computer, 46(8):52–59, August 2013.
- R. Thummarukudy. Designing a Configurable NVM Express Controller/Subsystem. http://www.flashmemorysummit.com/English/Collaterals/Proceedings/2014/20140807_I31_Thummarukudy.pdf, 2014.
- TPC. TPC-C Benchmark Standard Specification, Revision 5.11. http://www.tpc.org/tpcc/spec/tpcc_current.pdf, 2010.
- D. H. Walker. A Comparison of NVMe and AHCI. In The Serial ATA International Organization, 2012.
- J. Yang, D. B. Minturn, and F. Hady. When Poll is Better than Interrupt. In Proceedings of FAST, 2012.
- Y. J. Yu, D. I. Shin, W. Shin, N. Y. Song, J. W. Choi, H. S. Kim, H. Eom, and H. Y. Yeom. Optimizing the Block I/O Subsystem for Fast Storage Devices. ACM Transactions on Computer Systems (TOCS), 32(2), 2014.
- Dell. OLTP I/O Profile Study with Microsoft SQL 2012 Using EqualLogic PS Series Storage. http://i.dell.com/sites/doccontent/business/large-business/en/Documents/ BP1046_OLTP_IO_Profile_Study.pdf, 2013.
- F. X. Diebold. Big Data Dynamic Factor Models for Macroeconomic Measurementand Forecasting. In Eighth World Congress of the Econometric Society, 2000.
- A. P. Foong, B. Veal, and F. T. Hady. Towards SSD-Ready Enterprise Platforms. In Proceedings of ADMS at VLDB, pages 15–21, 2010.
- FusionIO. Fusion-io Flash Memory as RAM Relief. 2013.
- FusionIO. 1.1 a scalable block layer for high-performance ssd storage. http://kernelnewbies.org/Linux_3.13, 2014a.
- FusionIO. Fusion Power for MongoDB. http://www.fusionio.com/white-papers/fusion-power-for-mongodb, 2014b.
- HammerDB. Hammerdb, version 2.16. http://hammerora.sourceforge.net/, 2014.
- U. Hoelzle and L. A. Barroso. The Datacenter As a Computer: An Introduction to the Design of Warehouse-Scale Machines. Morgan and Claypool Publishers, 1st edition, 2009.
- X.-Y. Hu, E. Eleftheriou, R. Haas, L. LLiadis, and R. Pletka. Write Amplification Analysis in Flash-Based Solid State Drives. In Proceedings of SYSTOR, 2009.
- A. Huffman. NVM Express Revision 1.1. http://www.nvmexpress.org/wp-content/ uploads/NVM-Express-1_1.pdf, 2012.
- Huffman, A. and Juenemann, D. The Nonvolatile Memory Transformation of Client Storage. Computer, 46(8):38–44, August 2013.